Email Marketing Industry Benchmark 2021 (by Industry)
FREE Sign Up to our Latest E-Tips from RADICA
And Grow Your Business Online Quickly and Efficiently!
Introduction
The best way to evaluate your email marketing performance is to go through some benchmarks. From there, you can have a more precise picture of how your company is performing compared to competitors and identify areas to improve.
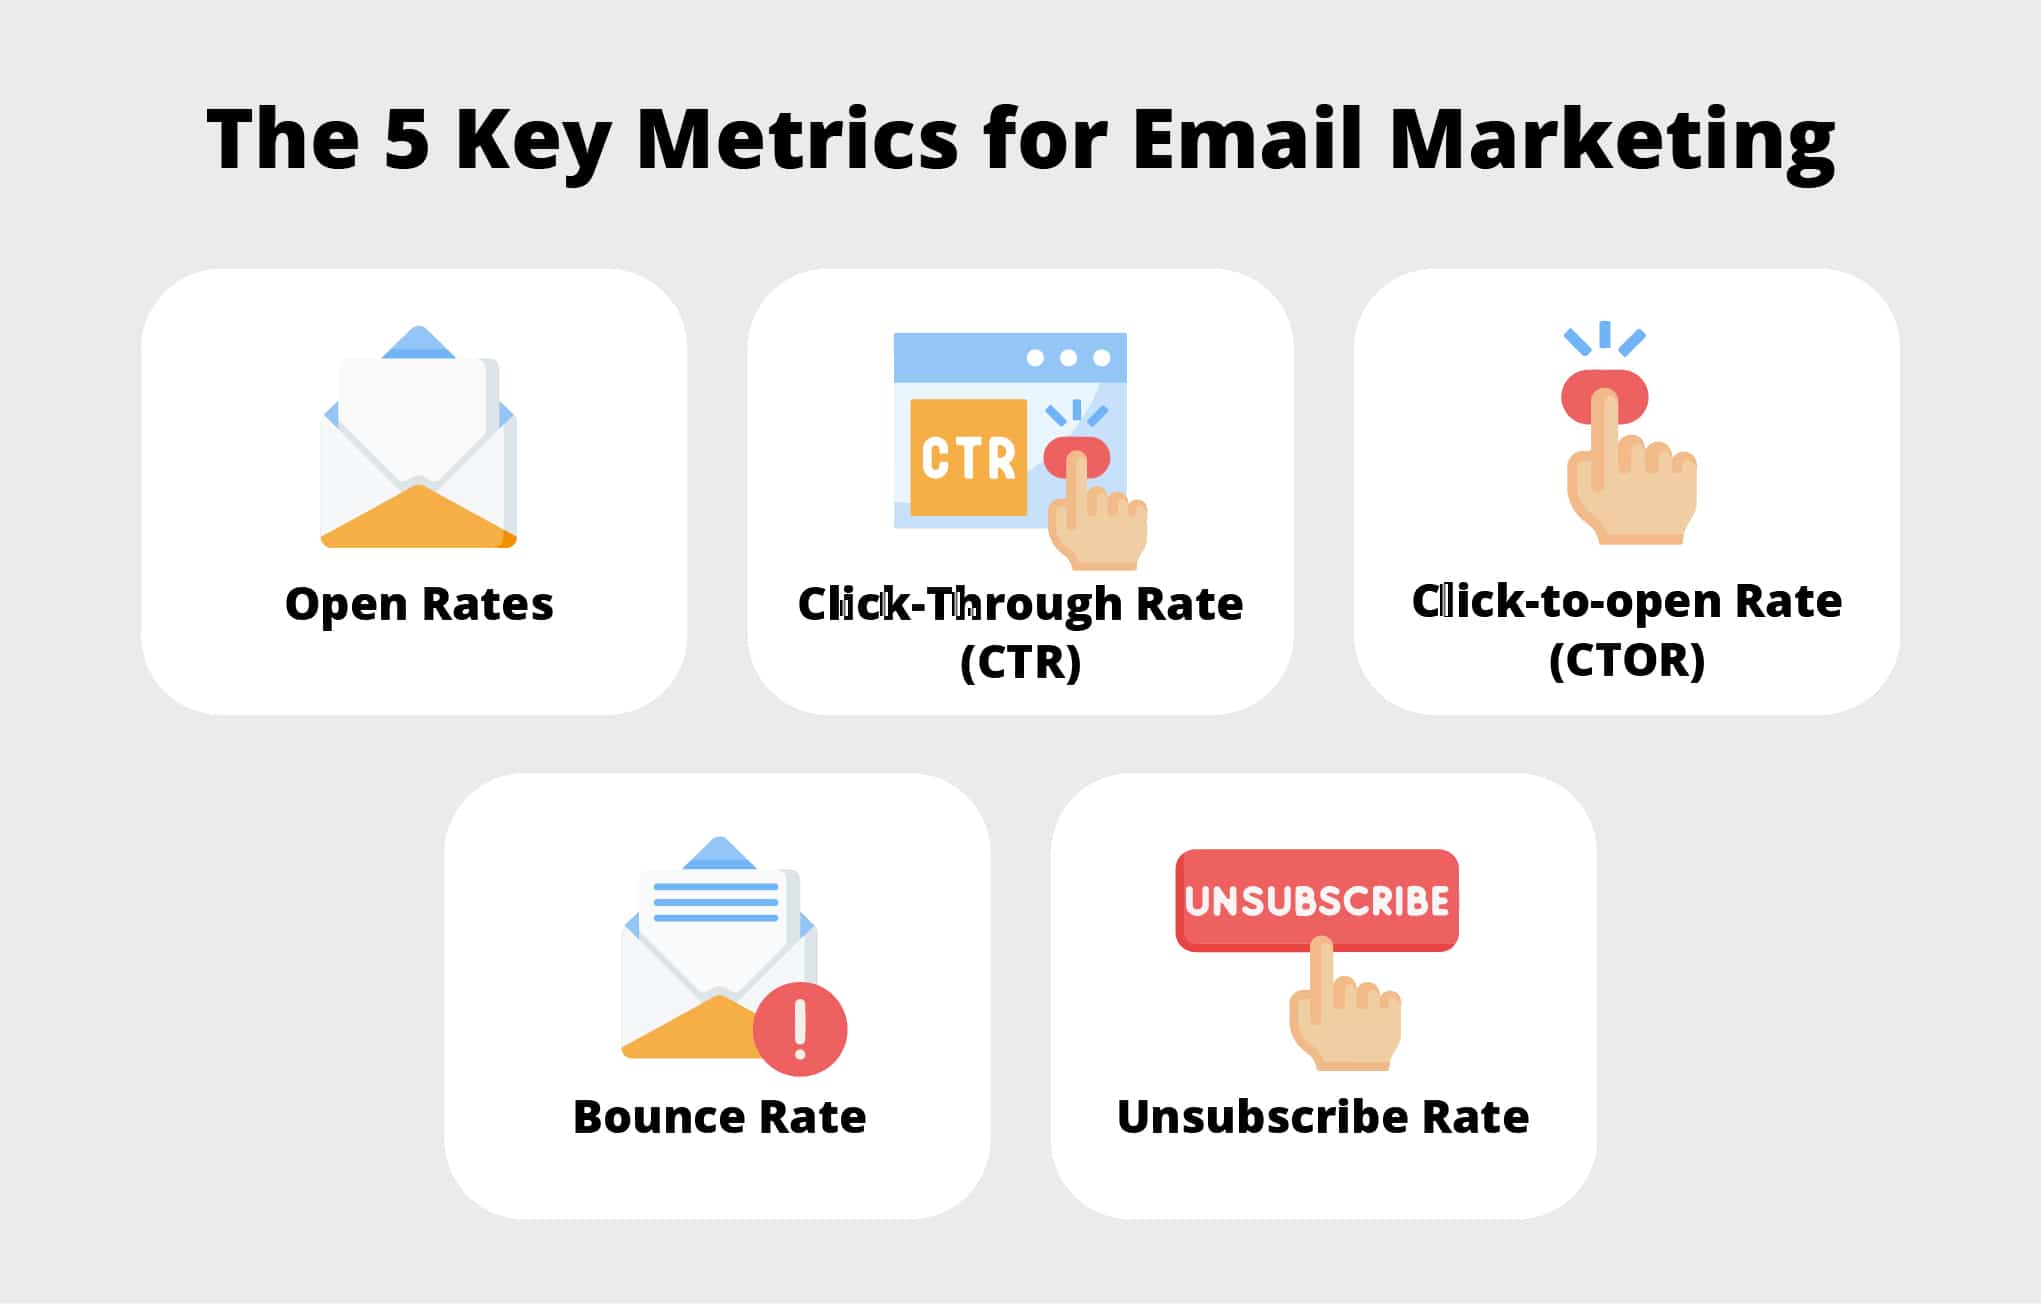
The 5 key metrics for email marketing are:
Open rate
Click-through rate (CTR)
Click-to-open rate (CTOR)
Unsubscribe rate
Bounce rate
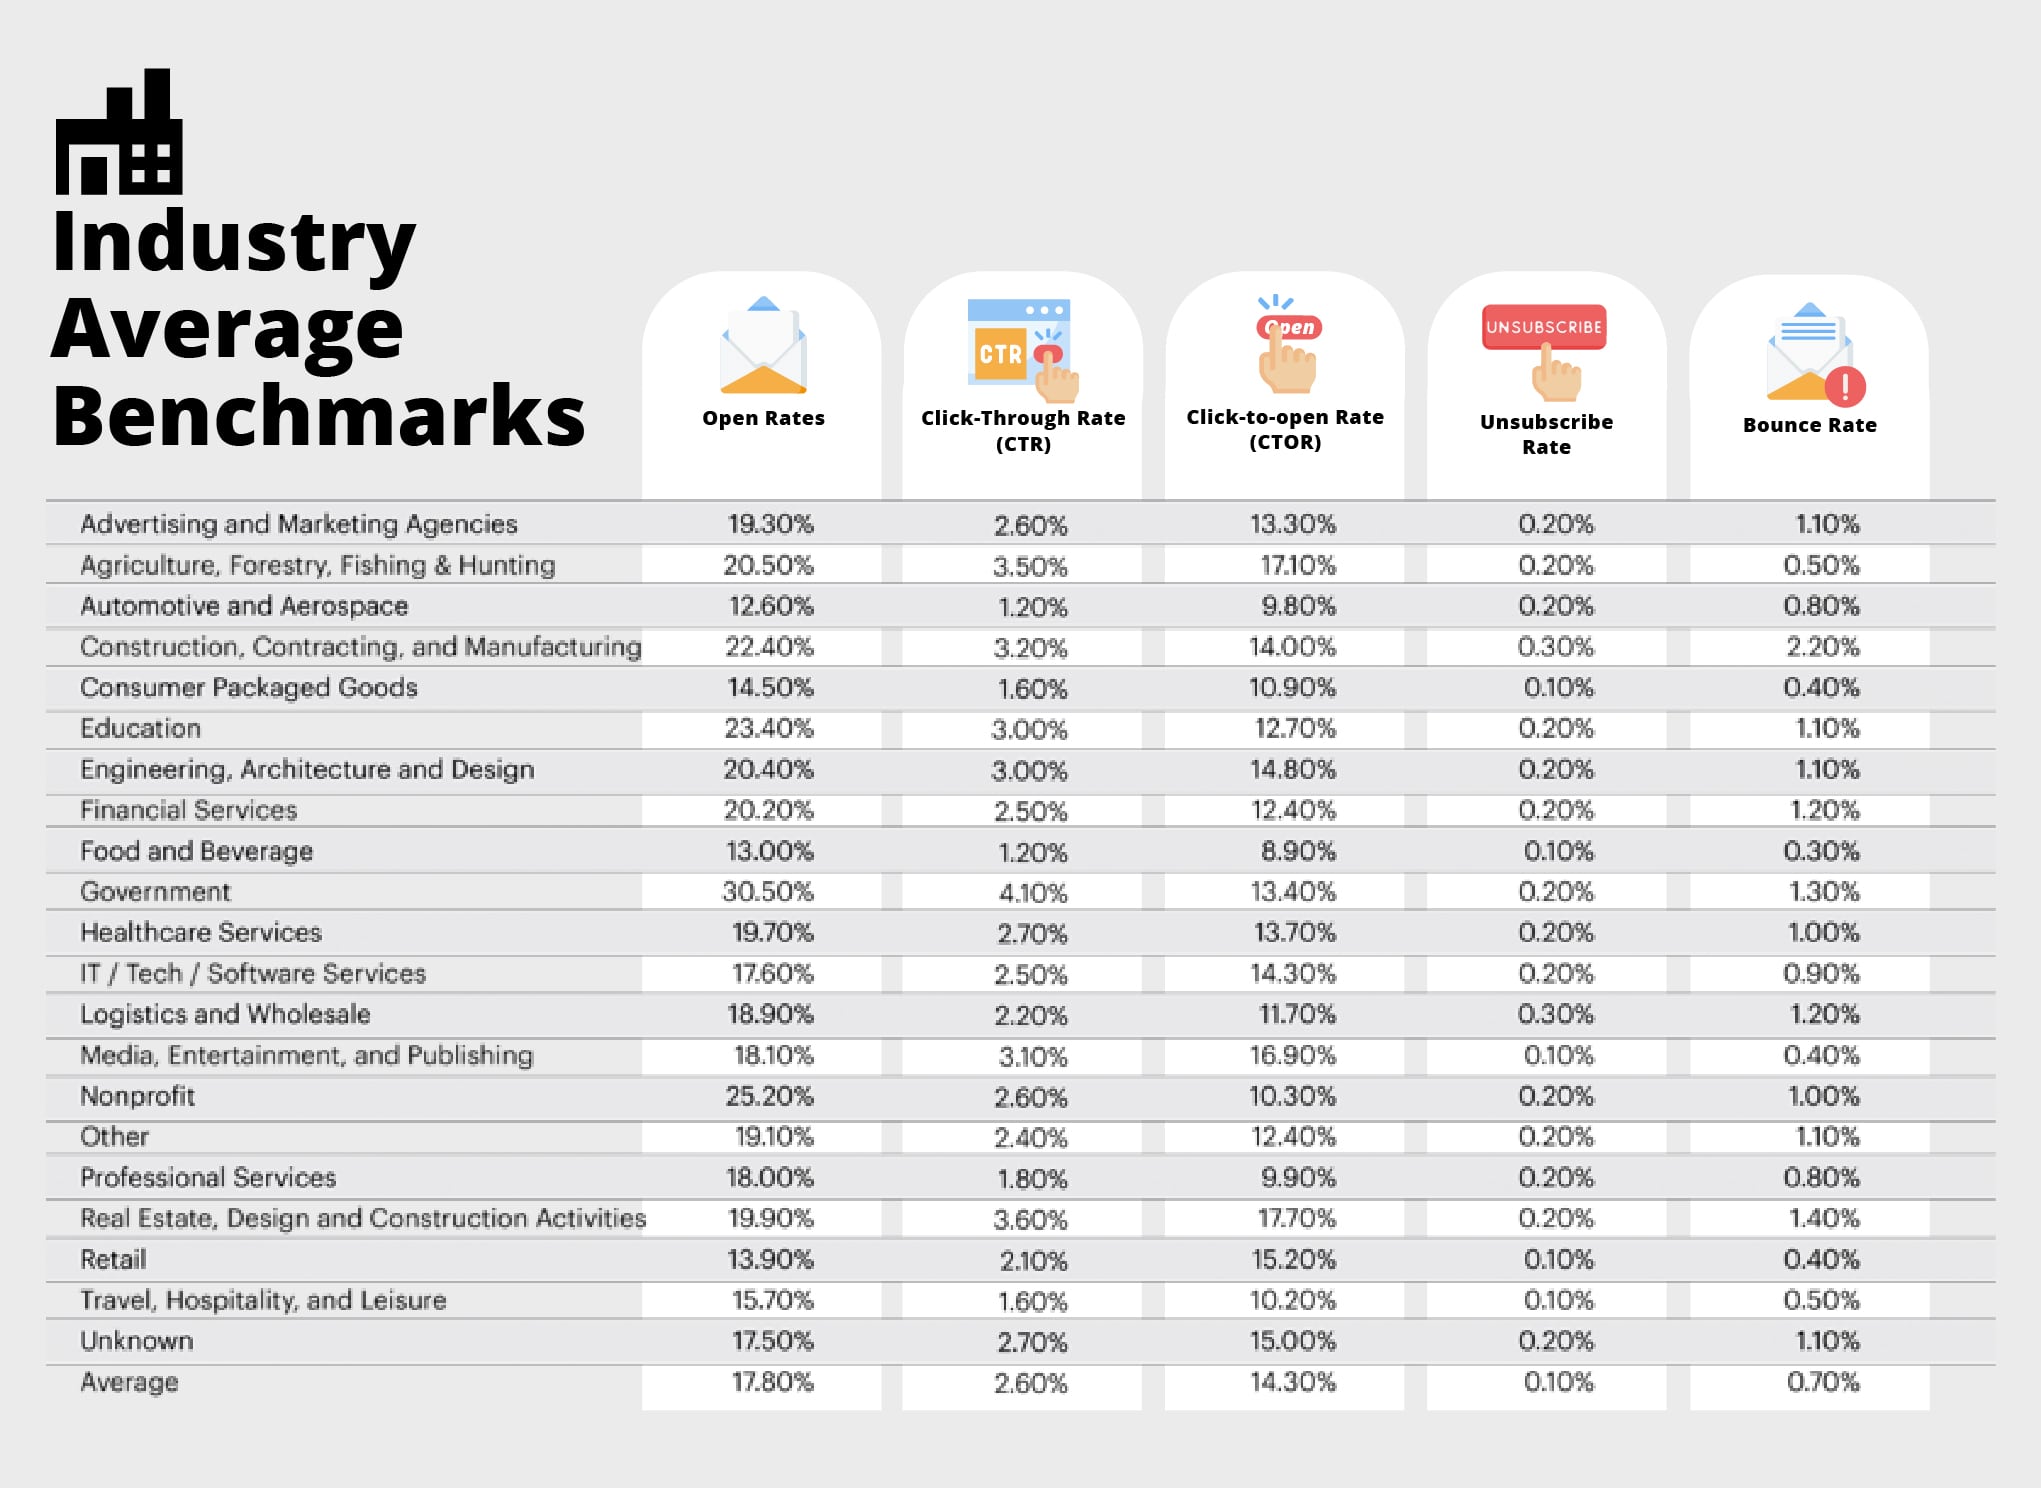
We have listed a widely accepted benchmark for the five types of email marketing benchmark averaged from multiple marketers’ statistics. However, the metrics are slightly different depending on the industry. Referencing Moengage, below are some industry benchmarks you may want to know before we dive in!
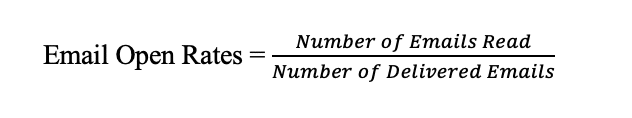
1. Average Open Rates
Email Open Rates = (Number of Emails Read)/(Number of Delivered Emails)
Open rate represents the percentage of recipients who opened your email campaign.
Average open rates for all industries: 20.4%
Average open rate in global: 22.02%
With no surprise, the industry chart showed that Government emails have the highest open rate, being the only one industry exceeding 30%. The non-profit industry took second place with an open rate of 25.20%. It seems like non-profit subscribers give more attention to their subscriptions than other profit industries. In contrast, Automotive and Aerospace emails had the lowest open rates, and surprisingly, Food and Beverage was the second-lowest industry 13% open rate only. This may be an indicator of a high number of inactive subscribers. Over time, this will harm your sender reputation and contribute to lower deliverability, dragging you into a vicious cycle. If you notice a low open rate in your company emails corresponding to the industry, try to pay attention to your regular data hygiene by updating your profile to avoid outdated contacts and sending segmented emails.
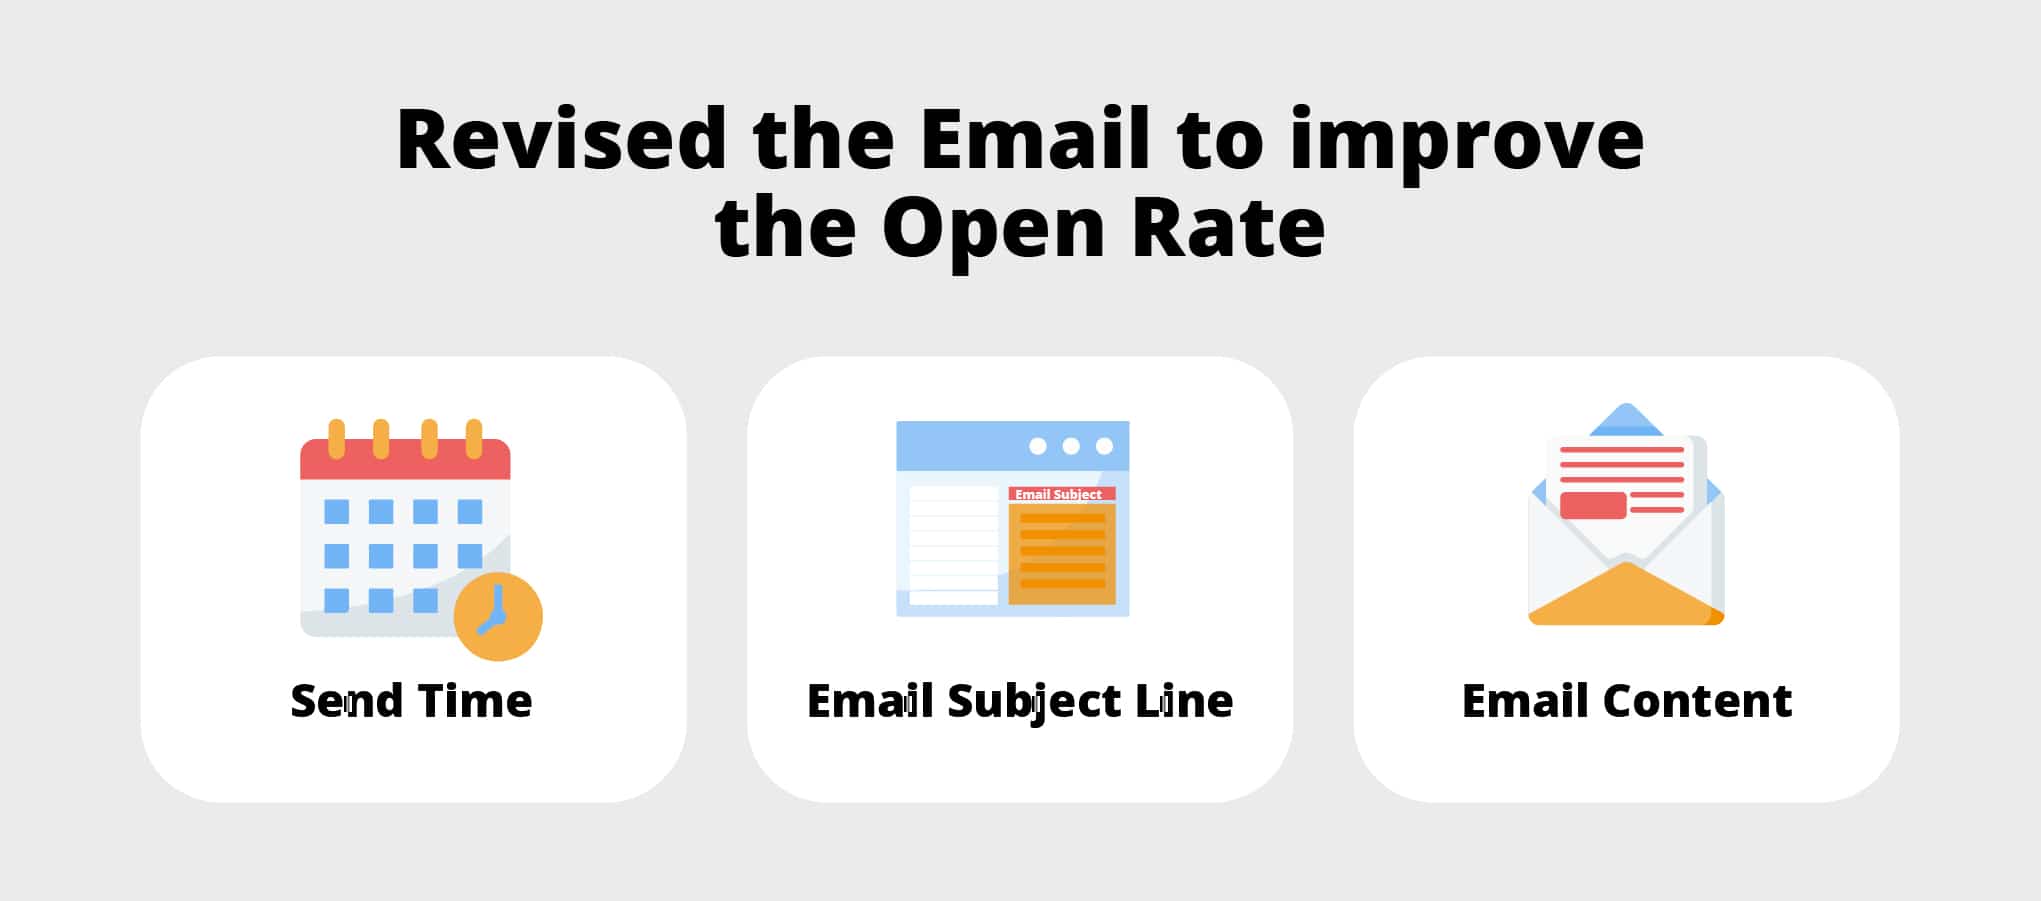
Several more things you should revise.
Send time
Email subject line line
Email content
Use an A/B test to look for the best fit send time of a day. People generally click on the latest email they see when opening their inbox. Schedules vary and affect an individual’s time to read emails. Preferences of a typical working individual and a student can be identified through testing. Similarly, use the A/B test to look for a subject line that attracts the recipient to click rather than skip. You may want to explore lines that grab the most attention, perhaps using humor and compassion.
2. Average Click-Through Rate (CTR)
Click-Through Rate = (Number of Recipients who Clicked a Link in your Email)/(Number of Emails Delivered)
Average CTR for all industries: 2.62%
Average CTR in global: 2.13%
Click-Through Ratesrepresents the percentage of recipients who has an activity with your email out of all your delivered emails. They can click on a link or image in your email campaign. It is a good way to check if audiences are interested in your content.
Pay attention to the formula you use. If you use “emails sent”, your CTR is more likely to be less than or equal to the formula that uses “email delivered” because it does not account for bounces. “Emails delivered” is calculated by subtracting bounces from emails sent!
From the industry chart, the Government continued its lead with 4.10% CTR followed by Real Estate, Design and Construction Activities emails with a 3.60%. Industries with the lowest CTR remained as Automotive and Aerospace and Food and Beverage, with 1.20% CTR only. Your average CTR should be in good hands between 2.5% – 3%. A below-average CTR indicates your content may not be as compelling to motivate recipients to click on the links. Consider creating stronger segments to send the most relevant content. Enhance your call-to-action with exciting incentives and better design. Again, A/B tests what works the best.
3. Average Click-To-Open Rate (CTOR)
Click-To-Open Rate = (Number of Unique Clicks )/(Number of Unique Emails Opened)
• Average CTOR benchmark: 14.90% • CTOR in global: 10.12%
Click-to-open rate is the percentage of recipients who click on unique clicks to unique opens. Do not get confused with CTR! Unlike CTR, CTOR focuses on the number of clicks out of the number of emails opened (not the number of emails delivered). CTOR is best to measure how resonating the design and messages are with your recipients.
The industry chart showed an interesting result with the Real Estate, Design and Construction Activities taking the lead in CTOR with 17.70% and Agriculture, Forestry, Fishing & Hunting was second with 17.10%. These two industries utilized their unique opens well! Food and Beverage emails only had a CTOR of 8.90%, close to a double drop. This is a strong warning to companies in F&B with low CTOR to reflect on their design of unique emails. A far below 14% CTOR means your messages need some fixing. They need to be moreclickable. The text and design need to be more noticeable and attractive, something that is easy to spot even when skimming.The email engagement history can help, as recipients click based on their needs and interests. For the third time, test till you find a satisfactory design, change styles and surprise your audiences.
4. Average unsubscribe rate
Average unsubscribe rate = (Number of Unsubscribe)/(Number of Emails Delivered )
Unsubscribe rate is the percentage of recipients who unsubscribe/opt out of your email list after receiving your email. • Average Unsubscribe rate benchmark: 0.19% • Unsubscribe rate in global: 0.12%
The industry shared approximately the same rate for this metric, even better if closer to zero. Unsubscribe rate is a metric you want to minimize. A high unsubscribe rate has several indications. Maybe your subscribers do not find your messages relevant or think you send too many emails and feel uncomfortable. There is no clear cut on the number of emails you should send. However, you can study by doing surveys and analyzing relevant past campaigns. Figure out the number of emails that keep your subscribers with you and adjust your campaign with marketing automation. Giving subscribers the ability to set their preferred frequency and content they wish to receive from your brand could be an alternative fix.
5. Average bounce rate
Bounce rate is the percentage of emails not delivered out of the total number of emails sent. • Average bounce rate 0.64%
The industry high in 2020 is from the Construction, Contracting, and Manufacturing industry, with a bounce rate of 2.20%. Companies in this industry may want to look into the component of the emails to reduce this high bounce rate. Bounce rate includes two types of bounce – hard bounce and soft bounce. A hard bounce holds a permanent reason e.g. an invalid email address or your recipient has marked your email address as spam. A soft bounce is explained by temporary reasons e.g. a file exceeding the size limit, the mailbox being full, or the email server is down. There are a lot of uncontrollable factors on the recipient’s side but what your side can do is maintain a healthy email list and ensure email deliverability using the email verifier tool. Remove invalid addresses from your email list and draft your email with content that does not fall as spam.
Additional Performance Benchmark
Our previous blogs have pointed out the importance of automated triggered emails and welcome emails. Let’s have a look at some metrics of these two types of emails before you hop back to your new year resolution!
Automated triggered email performance:
Open rate – 38.03%
Click-through rate (CTR) – 6.76%
Click-to-open rate (CTOR) -17.77%
Unsubscribe rate – 0.43%
Welcome emails:
Open rate – 86.03%
Click-through rate (CTR) – 24.69%
Click-to-open rate (CTOR) – 28.70%
Unsubscribe rate – 1.19%
Email marketing companies often support you with solutions to improve the above metrics such as to help clean your email list and evaluate your messages to prevent being filtered or blocked by recipients. Do not hesitate to discuss with them and find ways to improve your email marketing performance.
RADICA is a Hong Kong leading email marketing solution provider dedicated to accelerating revenue and maximizing customer connection with customer engagement solution in B2B, B2C and E-commerce industries. With RADICA’s advanced onmichannel marketing automation platform RI+, it is much easier and effective to spread out cross-channel messages with automated and personalised journey, even with high volume within short period of time. Our clients ranging from luxury, banking and insurance to food and beverage like Chanel, BEA, LEVI’s, Chow Sang Sang and Starbucks. Since 2000, RADICA as the leading email marketing and CRM agency in Hong Kong have focused on growing the value of their customer database by making wise use of data analytics in direct marketing. Learn more Radica Systems Limited at www.radicasys.com.